24-hour analysis
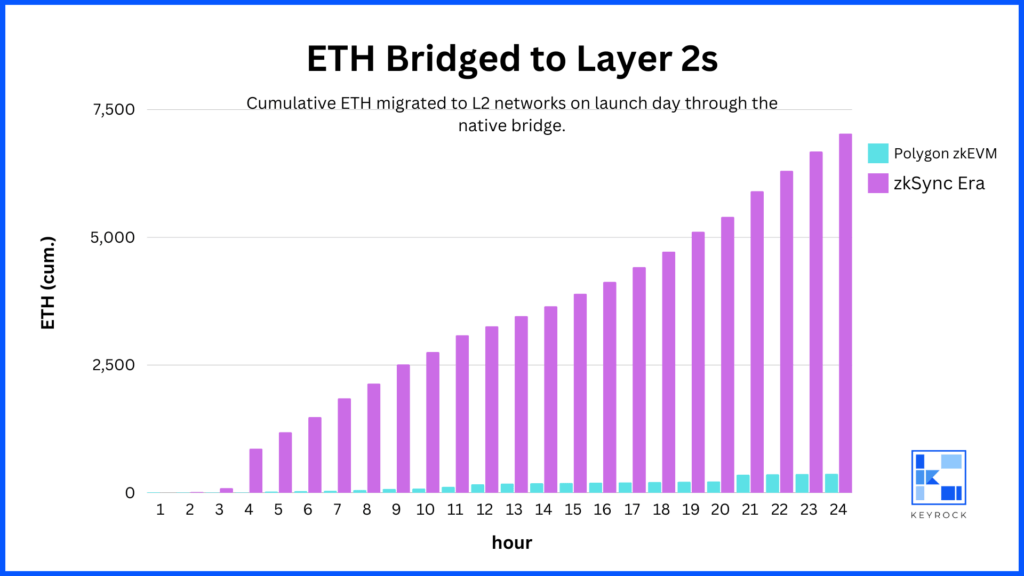
The graph below tracks cumulative ETH migrated to each L2 on its launch day, beginning at the hour on each chain when liquidity begins to pick up.
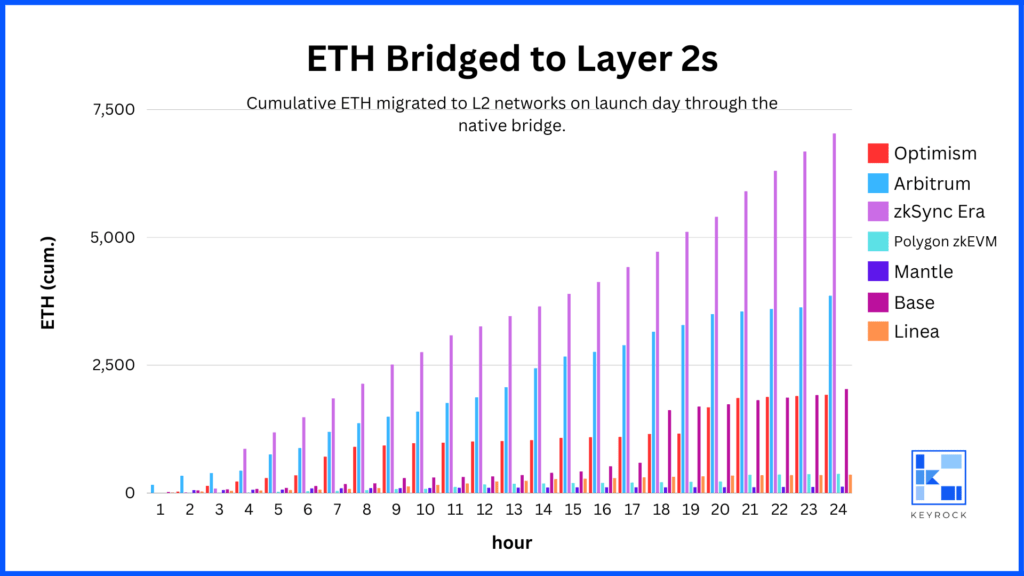
Looking at ETH liquidity migration in the first 24 hours of public launch, there is a clear outlier: zkSync Era. Built by Matter Labs, zkSync Era ended its first 24 hours with just over 7,000 ETH. The runner-up, Arbitrum, ended its first 24 hours with just over 3,800 ETH bridged.
Interestingly, these two launch outliers happened at very different times in the market. Arbitrum launched during a time period when L2s were significantly less tested, but also during a bull market with ETH at ~$3,200. zkSync Era launched not only during the current bear market (ETH ~$1,800) but also just two weeks after the SVB collapse which gave another shock to the crypto ecosystem.
It’s worth comparing the launch of zkSync Era to that of Polygon zkEVM, which launched its public mainnet just three days after zkSync Era, on March 27, 2023. Both zkSync and zkEVM promise to solve pervasive scaling issues through the implementation of zk-rollups. Although zkEVM launched during the same time as zkSync, with the same zk value proposition, and with arguably stronger brand recognition of Polygon than zkSync had with Matter Labs, it garnered much less ETH liquidity in its first 24 hours. Polygon zkEVM ended its first 24 hours with 373 ETH migrated, compared to zkSync’s 7,027.
The vast difference between zkEVM and zkSync can be explained by the airdrop likelihood of each layer 2. Following the high-profile Optimism and Arbitrum token distributions, layer 2 networks became the new focus for airdrop hunters. Early adopters (i.e., ETH migrators) of L2s assumed they would receive better token distributions later on.
Polygon, of course, already had a widely distributed, high-market cap token with MATIC prior to the zkEVM launch. ZkSync Era, on the other hand, had no token. With two zk-rollup layer 2s launching within days of each other, ETH holders opted to place their bets with the protocol that had yet to launch its token. As a whole, the crypto ecosystem is still hyper-focused on airdrop opportunities, and the simple fact that Polygon was unlikely to do another MATIC airdrop resulted in a huge variation in 24 hours ETH migration between the two layer 2s.
2-week analysis
Looking at a longer time period, we can see if trends from the L2s’ first 24 hours hold up over the first 2 weeks following their launches. The following chart tracks cumulative ETH migration from the Ethereum mainnet to these L2s through the official bridge contracts during each L2’s respective first two weeks.
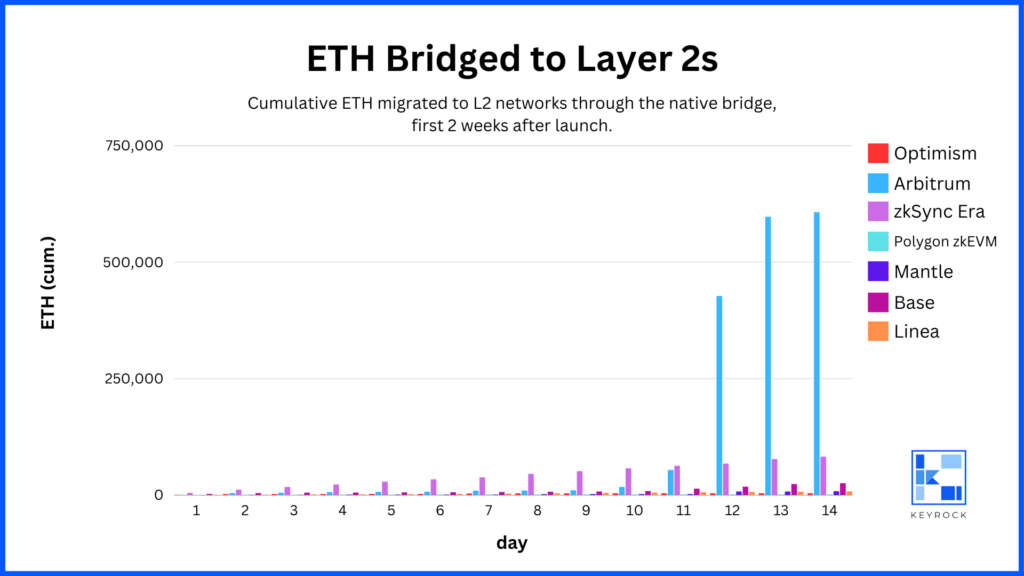
Though zkSync Era attracted 1.8x more ETH than Arbitrum in their respective first 24 hours (7,027 vs. 3,854), the 2-week time period reveals a significant deviation. Two weeks after their respective launches, Arbitrum had over 606,000 ETH bridged, whereas zkSync Era had just over 82,200.
In the first 24 hours of their respective launches, zkSync Era had attracted nearly 2x ETH than Arbitrum — even though it launched during the bear market. By the 12th day from their respective launches, however, Arbitrum had far surpassed zkSync Era. We will explore deeper into this question in the future, but our best guess is the incentive for future token distribution is what made the difference as zkSync Era launched after multiple high-profile token distributions. There’s a good chance liquidity flooded into zkSync Era in the first 24 hours as people sought to “get their foot in the door” for the future airdrop. That may have resulted in an initial spike in the initial 24 hours and then slower growth over 2 weeks.
If we remove the Arbitrum and zkSync data points (graph below), we can better compare the two-week traction of the other 5 chains.
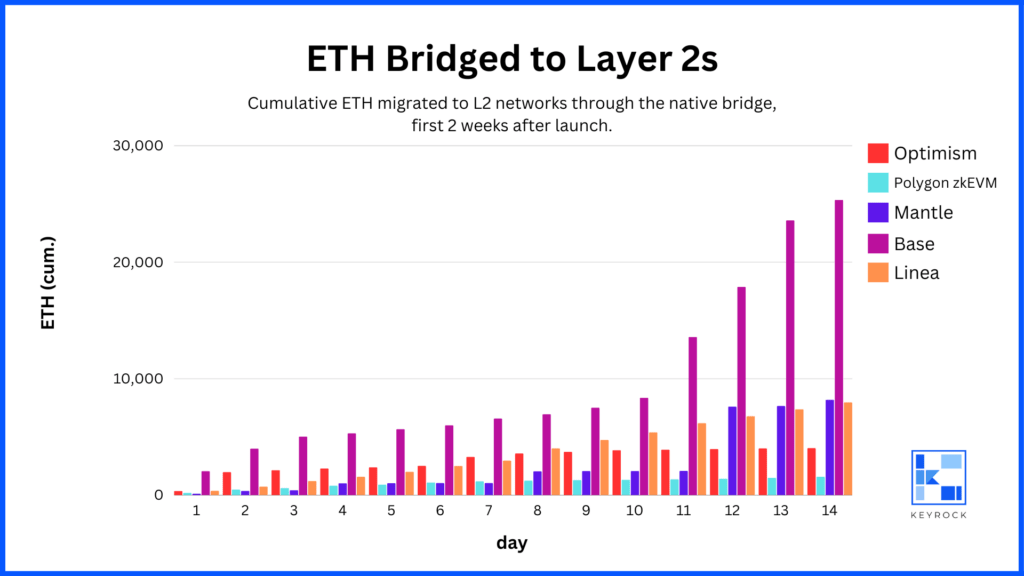
Among the remaining L2s, zkSync Era still comes out on top, followed by Base. Once again, Polygon zkEVM deserves a closer look. In its first 24 hours, Polygon zkEVM had a similar ETH liquidity migration as Linea (zkEVM = 373 ETH, Linea = 358 ETH) and had surpassed Mantle (Mantle = 123 ETH). By the 2-week mark, however, Polygon zkEVM appears to have petered out compared to Linea and had lost significant ground to Mantle, given its initial 24-hour success.
We decided to dive in deeper and try to determine why Polygon lost ground to Mantle over the 2 week period, despite having a more successful first 24 hours. The graph below compares cumulative ETH bridged to Polygon zkEVM, Linea, and Mantle over their respective first two weeks after launch.
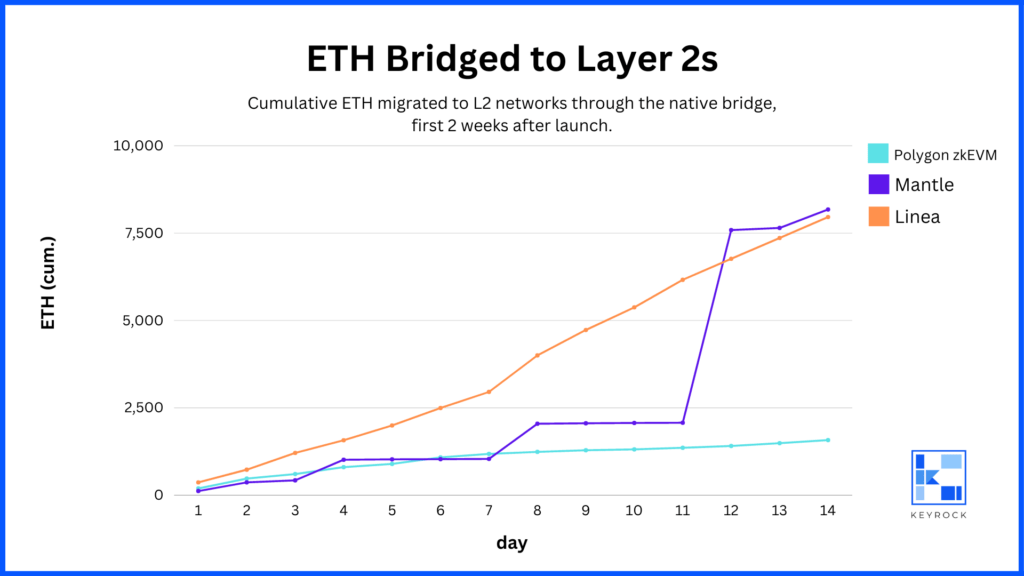
Looking even deeper into Mantle’s growth, we see that for most of its first two weeks, it was lagging behind Linea and just barely keeping pace with Polygon. That changed on day 12 after the mainnet launch, July 28. Between the hours of 17:00 and 18:00 pm UTC, 5,000 ETH was bridged from Ethereum to Mantle, increasing the cumulative ETH bridged from ~2,500 to above 7,500. Without this outlier injection of capital, it is likely Mantle would not have surpassed Linea in ETH bridged. The chart below shows the hour-by-hour breakdown of cumulative ETH bridged to Mantle on July 28, 2023.
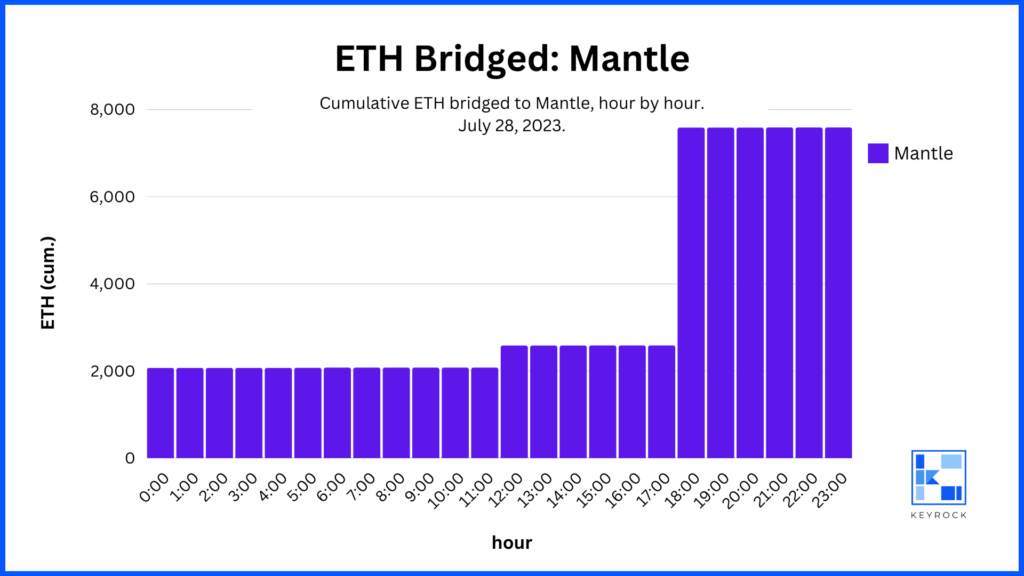
As we can see above, Mantle’s ETH liquidity growth remained fairly consistent on July 28th, with the exception of a 500 ETH migration between 11:00 – 12:00 and then the major 5,000 ETH migration between 17:00 – 18:00. The 5,000 ETH was deposited by a single address (0x…178D), which is a Bybit deposit address.
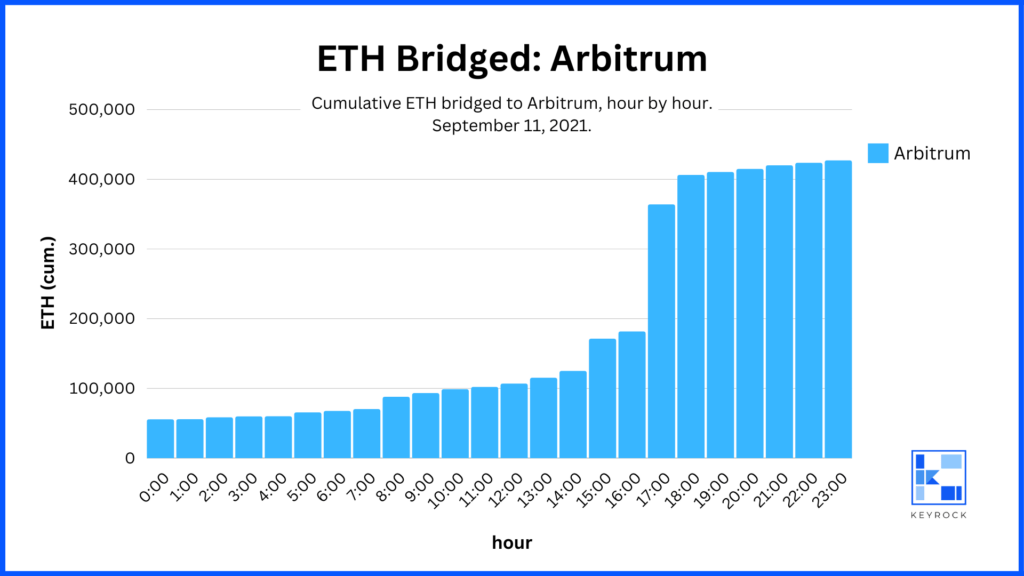
No other L2 has such an outlier amount of ETH bridged during its first 2-week period except for Arbitrum. On September 11th, 2021 (10 days after its launch), between the hours of 16:00 and 17:00 UTC, over 180,000 ETH was bridged to Arbitrum. Over 168,000 of that ETH (+92%) was deposited by a single address (0x…54c3), which is an Alameda address. The single Alameda deposit of 180k ETH alone nearly doubled the total ETH bridged to Arbitrum, from ~180k to ~360k.