August 10, 2023
Uniswap V4 Liquidity Migration: A Prediction
Uniswap is on the verge of another major upgrade from V3 to V4. Looking at on-chain data from the last Uniswap upgrade from V2 to V3, what can we predict about the upcoming event?
Uniswap is on the verge of another major upgrade from V3 to V4. Looking at on-chain data from the last Uniswap upgrade from V2 to V3, what can we predict about the upcoming event?

In June, Uniswap announced their plans for Uniswap V4, the next major protocol upgrade for crypto’s largest AMM.
Uniswap V4 comes with significant changes to how the AMM functions, introducing a singleton smart contract model with customizable hooks for enhanced pool operations. This new design promotes greater customization and operational efficiency for Uniswap. By reducing gas fees and offering a more open-source approach, Uniswap v4 empowers market makers with innovative strategies and increased control over their operations. See our recent blog post for a more detailed summary of Uniswap V4’s major components.
Prior to the June announcement, the last major upgrade of Uniswap was the launch of V3 on May 5, 2021. V3 launched about one year after V2 went live, on May 17, 2020. We recently did a data comparison of different V3 AMMs (Uniswap vs. PancakeSwap vs. SushiSwap). With the news of Uniswap V4’s launch, we asked how traders and LPs will react when V4 goes live. To answer the question, we went back and looked at how Uniswap users acted when V2 and V3 went live. The comparison of LPs and liquidity from V2 to V3 will give us a starting point to anticipate what will happen in the days and weeks following the V4 launch.
We understand that Uniswap V2 and Uniswap V3 launched in considerably different market conditions, which impacts our conclusions. Uniswap V2 launched in the period of time after the 2019 DeFi summer and in the depths of the pandemic bear market. Uniswap V3 launched near the height of the NFT-driven bull market. To mitigate the impact of the varying market conditions, we analyzed liquidity for the V2 and V3 launches in both short-term (24-hour) and long-term (months) ranges. In general, we observed the following:
With these observations in mind from the V2 and V3 launches, we presumed the same three general observations will be made when V4 goes live:
We broke down our analysis into three sections, looking at different elements of Uniswap’s liquidity: TVL, Liquidity Pools, and Liquidity Migration. As mentioned, for each, we observed short-term and long-term data.
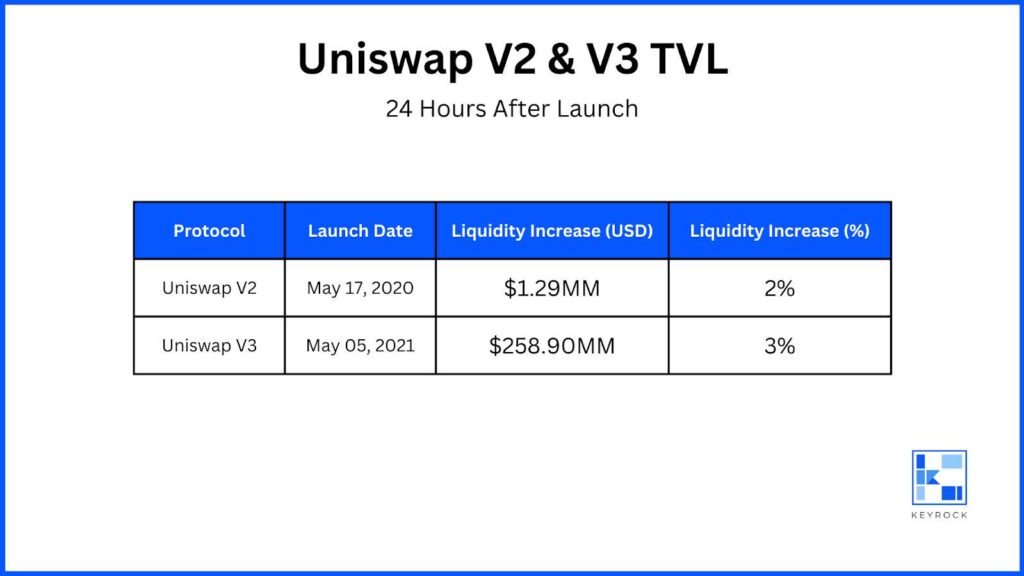
In the 24 hours after V2’s launch, TVL on Uniswap increased by $1.29M, a roughly 2% increase from May 17’s TVL of $62.9M. Twenty-four hours after the V3 launch, TVL on Uniswap increased by $258.9M, a roughly 2.8% increase from its pre-launch TVL. Despite the varying markets, the immediate post-launch TVL increase remained comparable across V2 and V3 in the 24 hours after launch. Crypto is plagued with stories of newly-launch smart contracts being exploited. Even with Uniswap’s market dominance and confidence, it is not unlikely that many LPs held back from jumping immediately into the new Uniswap contracts, waiting to see if any incidents occurred in the days after launch before migrating their own liquidity.
Looking towards V4, history suggests that regardless of the market conditions, we won’t see a significant increase in liquidity in the 24 hours after launch. If the market is bearish, we’re likely to see closer to a 2% increase. If the market is bullish, we are likely to see closer to a 3% increase.
The launch of Uniswap V2 was just the beginning of the Uniswap protocol, looking at a broader timeline. By August 2020, Uniswap’s TVL was about to turn parabolic, accelerated by the launch of UNI in September 2020. By comparison, the launch of Uniswap V3 marked (at the time) the height of Uniswap’s dominance (measured by TVL). Shortly after V3’s launch, Uniswap reached its historical maximum of $10.24bn USD in TVL.
The DeFi market’s overall TVL would not reach its historical maximum until November 2021, but Uniswap V3 did not benefit proportionally from that last bull run. This is likely due to rising competition in the AMM ecosystem, with burgeoning projects offering more attractive yield farming schemes and siphoning liquidity from market leaders like Uniswap.
In the first 24 hours after the launch of Uniswap V2, 183 distinct pools were launched. In the first 24 hours after the launch of Uniswap V3, 51 distinct pools were launched. It’s also important to note that Uniswap V3 introduced fee tiers, such as ETH/USDC 0.05% and 0.3%, each of which is counted as a separate pool.
We see a similar variance in the number of individual LPs participating in V2 vs. V3 in its first 24 hours. Twenty-four hours after V2 launched, over 800 individual LPs had added or removed liquidity. By comparison, 24 hours after V3 launched, ~175 individual LPs had added or removed liquidity (roughly 100 of those LPs only participated in the final 2 hours).
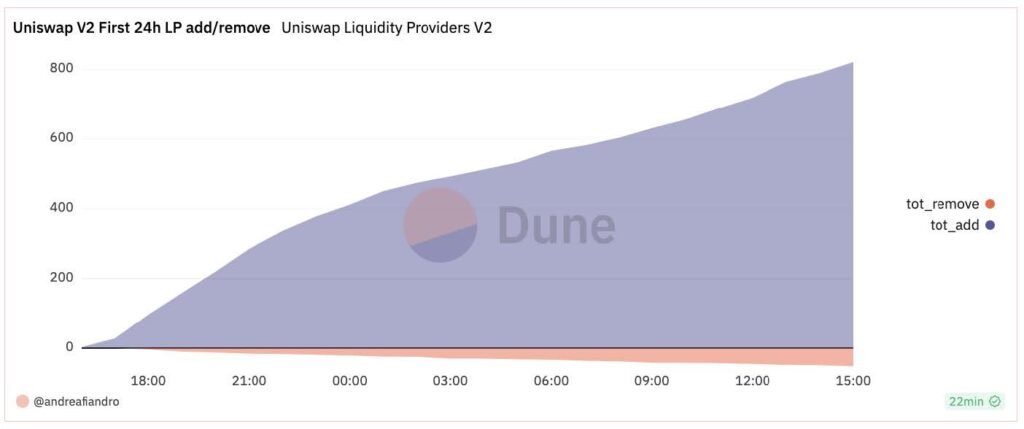
Individual LPs on Uniswap V2, 24 hours after launch.
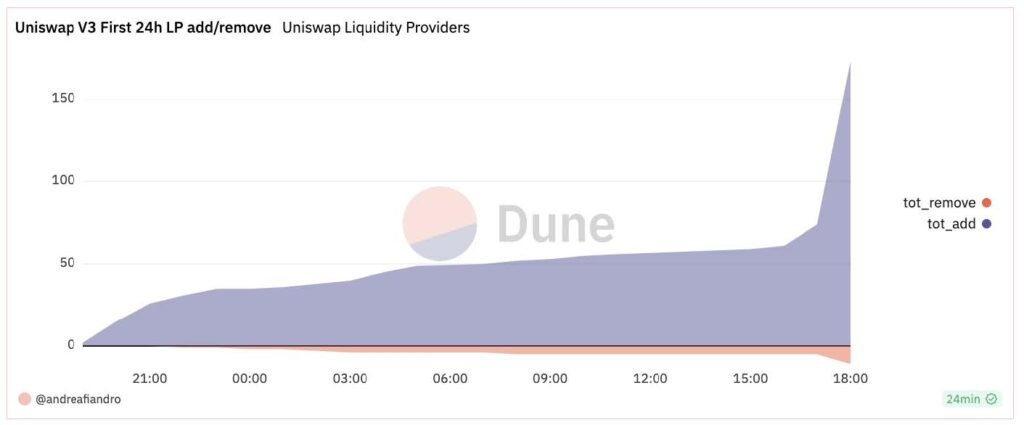
Individual LPs on Uniswap V3, 24 hours after launch.
Looking at the number of pools long-term, we see the imbalance between V2 and V3 continue. A year after V2’s launch, there were about 40,000 pools on Uniswap. A year after V3’s launch, there were about 7,000. When comparing the V2 and V3 launches, all numbers (TVL, liquidity migrated, etc.) are larger on V3 than V2 — with the exception of LPs in the first 24 hours and the number of pools both long and short term. We explain this variance with two possibilities:
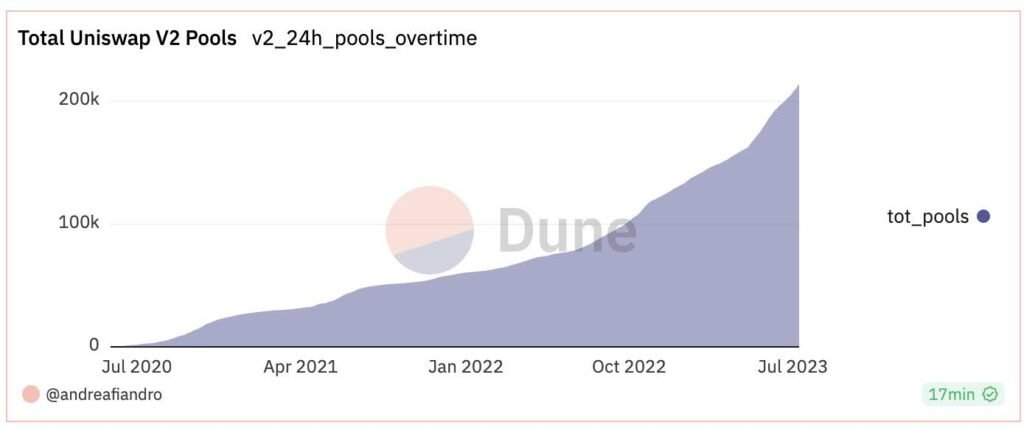
Total pools on Uniswap V2, May 2020 – July 2023.
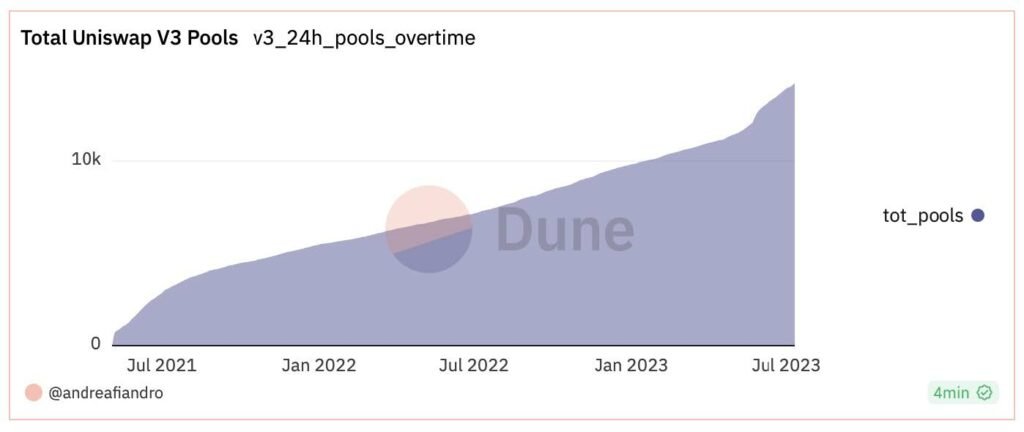
Total pools on Uniswap V3, May 2021 – July 2023.
To look at the behavior of liquidity from V2 to V3 after the V3 launch, we looked at three high-volume token pairs: ETH/USDT, ETH/USDC, and WBTC/ETH.
Overall, we found that the liquidity drain from V2 was most consistent with the WBTC/ETH (volatile-volatile) pair. In contrast, the liquidity in ETH/USDT and ETH/USDC (volatile-stable) liquidity increased and decreased in the months following the V3 launch, though net decreasing over time.
For each token pair, we look at the decrease in V2 liquidity following the launch of V3, and we look at the increase in V3 liquidity (across all fee pools) over the same period of time. Let’s dive into each pair.
V2 liquidity in the ETH/USDT pool steadily increased during the month before the V3 launch. Following the launch, liquidity dropped by over half, from ~$350MM to <$150MM.
Instead of continuing to fall, however, V2 liquidity for this token pair wavered, recovering to a height of $300M within 30 days after launch.
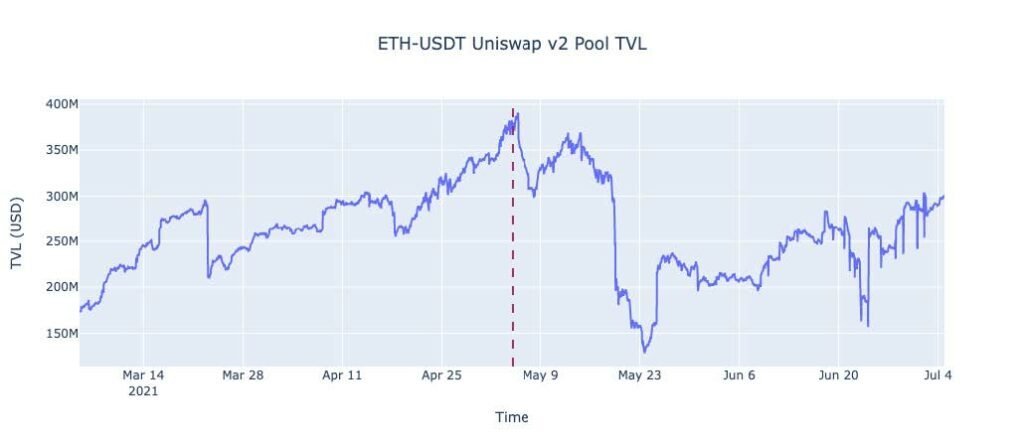
ETH/USDT Uniswap V2 Pool. TVL March 2021 – July 2021.
Red line is Uniswap V3 launch on May 5, 2021.
The graph below compares the liquidity of ETH/USDT in V2 (blue) compared to the liquidity of the token pair across the three fee pools in V3 — starting on the day of the V3 launch. Overall, we see liquidity moving from V2 to V3, with V3 liquidity decidedly flipping V2 liquidity in late January 2022.
As shown below, the 0.05% fee tier had a slower adoption than the 0.3% fee tier, which saw an immediate influx of liquidity in the days and weeks following the V3 launch. The fee tier system of Uniswap was brand new to V3, and it’s not unlikely initially, it wasn’t used optimally. LPs may have gravitated immediately towards the higher % fee tier as a knee-jerk reaction. Over time, either these 0.3% fee LPs better understood V3’s fee structure and migrated their liquidity to the 0.05% tier, and/or sophisticated traders that understood the nuances took a couple of months before providing notable liquidity to the 0.05% tier.
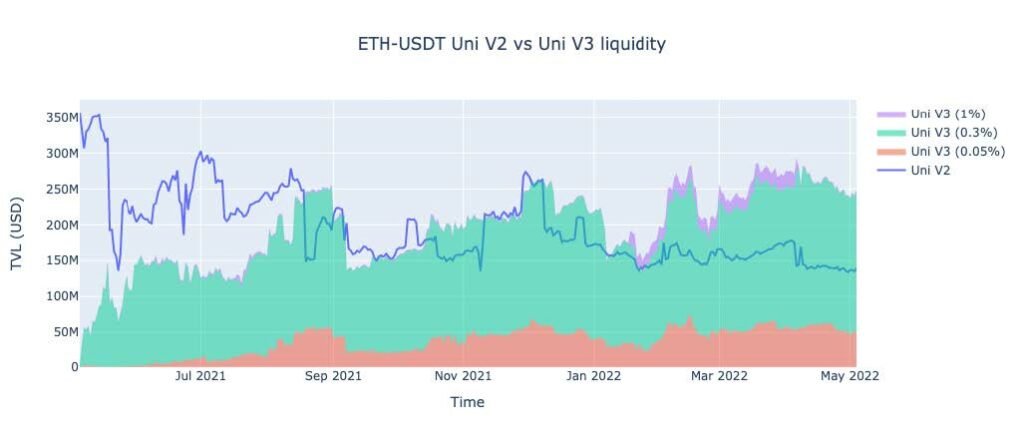
ETH/USDT V2 TVL (blue) vs. V3 TVL.
May 5, 2021, to May 2022.
Similar to ETH/USDT, the ETH/USDC token pair was steadily increasing in V2 liquidity until the V3 launch. After an initial decrease in liquidity after V3’s launch, ETH/USDC liquidity also wavered, jumping up and down in the weeks after the V3 launch.
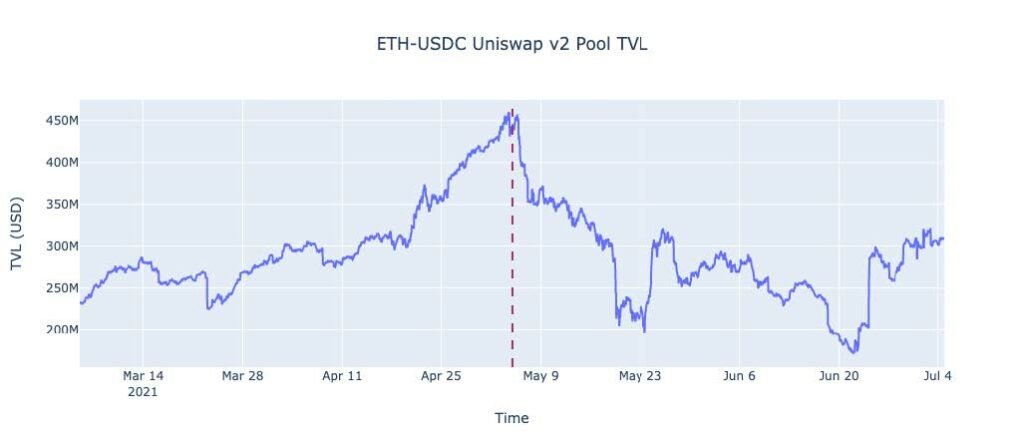
ETH/USDC Uniswap V2 Pool. TVL March 2021 – July 2021.
Red line is Uniswap V3 launch on May 5, 2021.
The ETH/USDC token pair experienced a higher velocity of liquidity provision following the V3 launch than ETH/USDT, as shown below. ETH/USDC V3 liquidity decidedly flipped V2 liquidity much quicker than ETH/USDT — in 22 days.
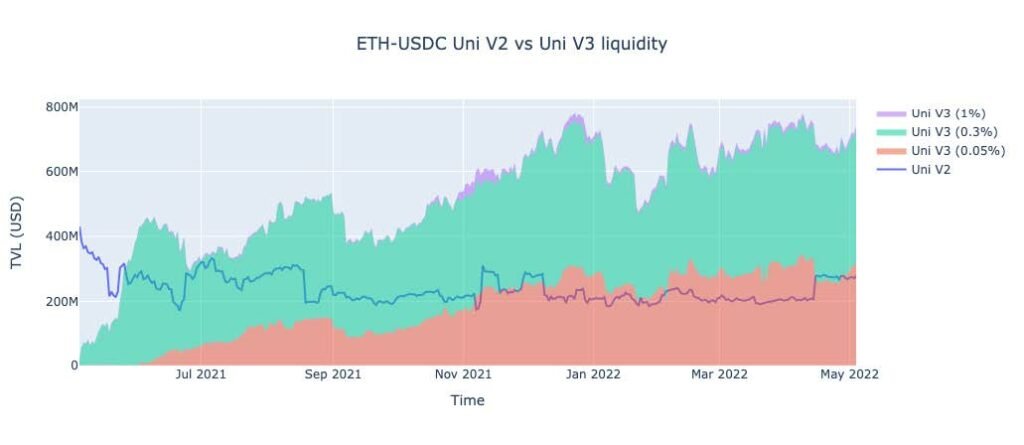
ETH/USDC V2 TVL (blue) vs. V3 TVL. May 5, 2021 to May 2022.
Both volatile-stable token pairs share the following liquidity behaviors after the V3 launch:
The novelty of the V3 fee tier system may answer both observations. Wavering V3 liquidity could be explained by routing services like 1inch, which automatically divert liquidity to optimal pools. These sorts of routers may have taken some time to catch up to V3’s tier system, and in the meantime may have been diverting liquidity back towards V2.
The fee system may have also reasonably caused confusion in LPs. Seeing a 0.3% fee tier for a stable-stable token pair, LPs may have chosen instinctively to enter that pool, before eventually learning the nuances of V3 and choosing to migrate to 0.05%. The outlier here is the slow adoption of the 1% pool, which — if we follow the theory above — should have seen significant immediate liquidity gains, followed by a drop-off. We have two ideas for why this may not have happened:
Unlike both volatile-stable pairs discussed above, the WBTC/ETH token pair experienced a steady, unbroken decline in liquidity following the V3 launch.

WBTC/ETH Uniswap V2 Pool. TVL March 2021 – July 2021.
Red line is Uniswap V3 launch on May 5, 2021.
As V2 WBTC/ETH liquidity was decreasing or remaining stable, the V3 liquidity was rapidly increasing, concentrated mainly in the 0.3% pool. The decrease in V2 and increase in V3 liquidity appear to be inversely correlated in the first days of the V3 launch and then become decorrelated as V3 matures. V3 liquidity flipped V2 liquidity after 19 days.
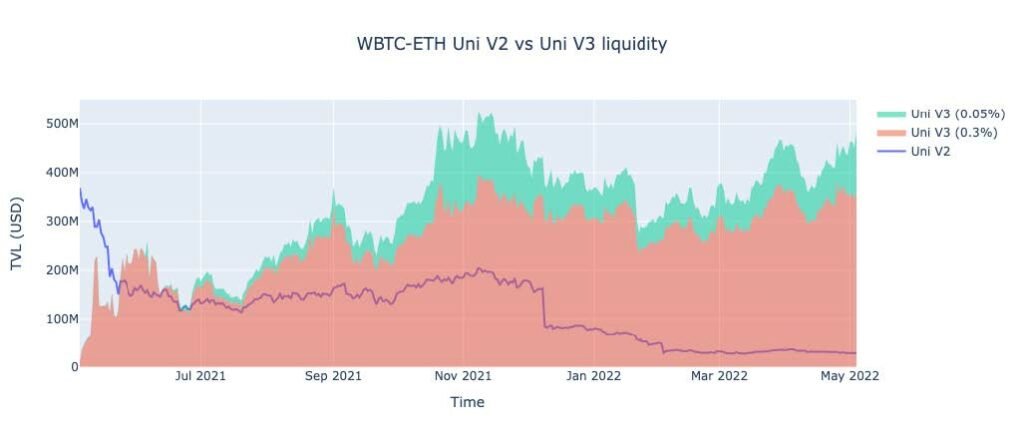
WBTC/ETH V2 TVL (blue) vs. V3 TVL.
May 5, 2021, to May 2022.
Across the three token pairs analyzed, the two volatile-stable pairs experienced a less consistent decline in liquidity. On the other hand, the volatile-volatile pair steadily and rapidly declined in V2 liquidity.
One explanation of the different behavior of liquidity providers could be the unique consequences of withdrawing liquidity for a stable-volatile token pair versus a volatile-volatile token pair.
Remember that Uniswap V3 was launched at a high point in the crypto and DeFi market. For stable-volatile token pairs, the volatile token increased dramatically in price, with the stable token remaining constant. This likely resulted in impermanent loss, which could be considerable for people who have provided liquidity earlier in the history of Uniswap V2. When considering whether to migrate their liquidity to V3, these people may have decided not to actualize the impermanent loss of their position, choosing to keep their liquidity in V2.
For LPs of the volatile-volatile pair, their impermanent loss likely was not as considerable, especially since the ETH and BTC markets were relatively comparable during the bull run of 2021. With less impermanent loss consequences, these LPs may have felt more comfortable moving their liquidity from V2 to V3, capturing the 0.3% fee pool opportunity.
Looking ahead to Uniswap V4, the behavior of liquidity providers will, of course, be dependent on the market. But we can make a few predictions based on the movement of liquidity during the transition from V2 to V3:
V4 is estimated to roll out starting in Q3 2023. Learn more about Uniswap V4 and what it means for liquidity providers here.
Stay in the loop and learn more by following on Twitter, LinkedIn, or Lens. You can also contact us today if you’re interested in market making services.
The conclusions drawn in this article are based solely on publicly available data, and the information presented is intended for educational purposes only. It is not to be construed as financial advice, investment recommendations, or a solicitation or incitement to buy, sell, or trade digital assets or any other financial instruments.