Our Metrics
Spotting wash trading can be a dire task. Many parameters are to be considered. Without forgetting an astute expertise to uncover these patterns. But if we were to give a crash course on detecting wash trading, here’s how to look at 3 critical metrics:
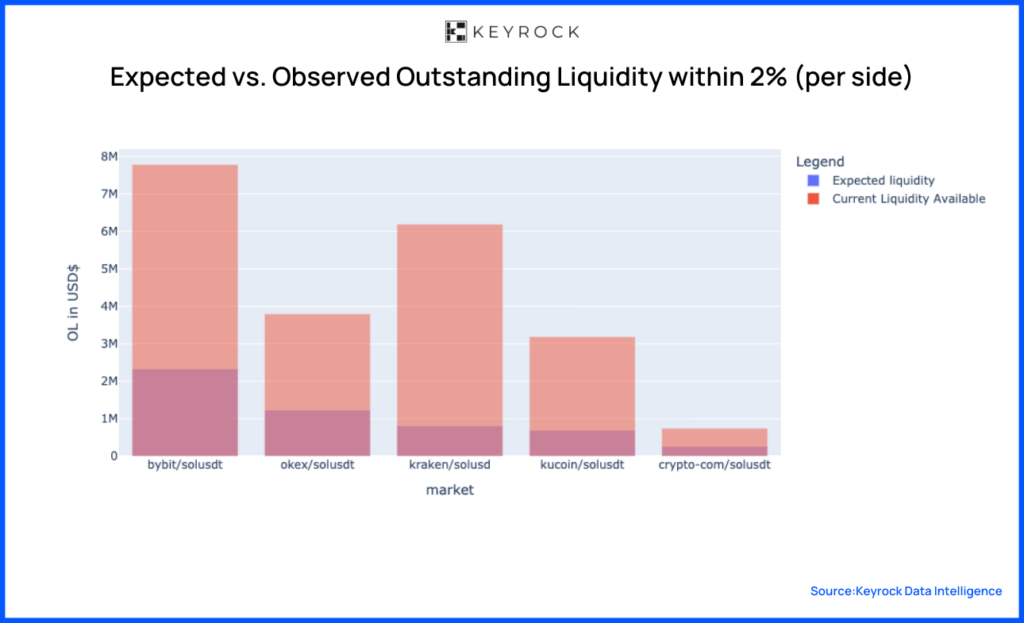
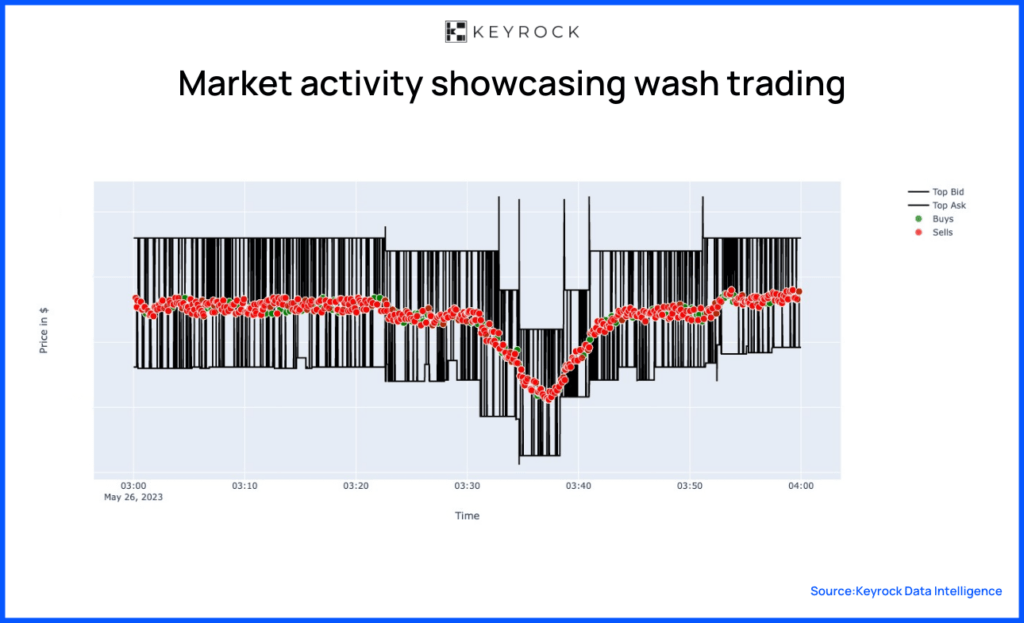
Quality of the order book
Does the order book look healthy? We analyse the Volume vs. Depth Ratio. For example, $1m in volume / $100 in market depth is a significant signal that there’s potentially wash trading happening in that market.
Let’s look at a specific example. Below, we can see an undisclosed market in which all the buys and sells are exactly at the same price. There’s essentially no spread. And this doesn’t happen only once but over an extended period of time.
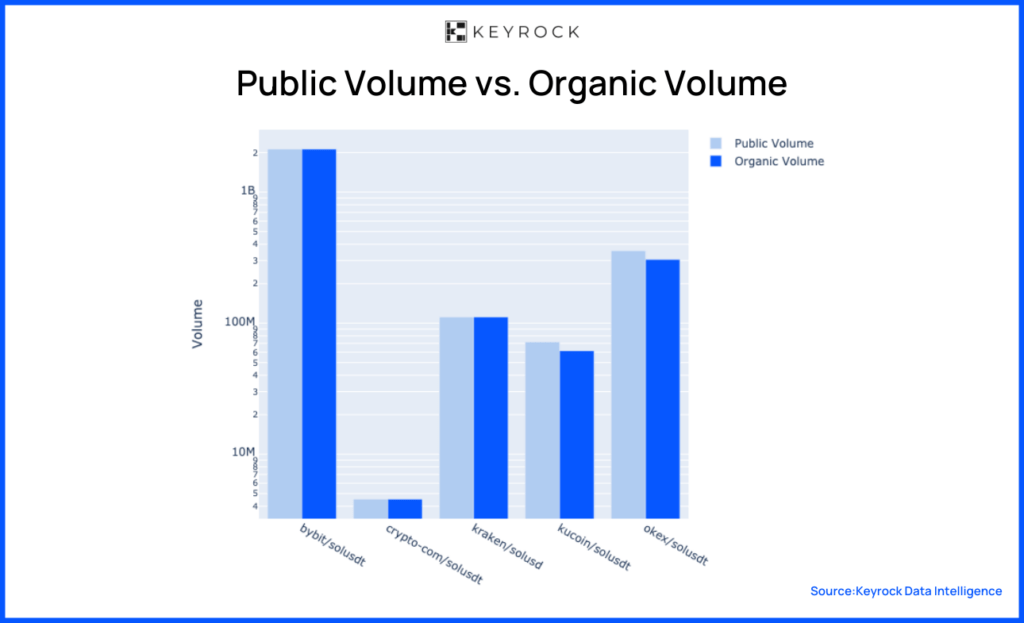
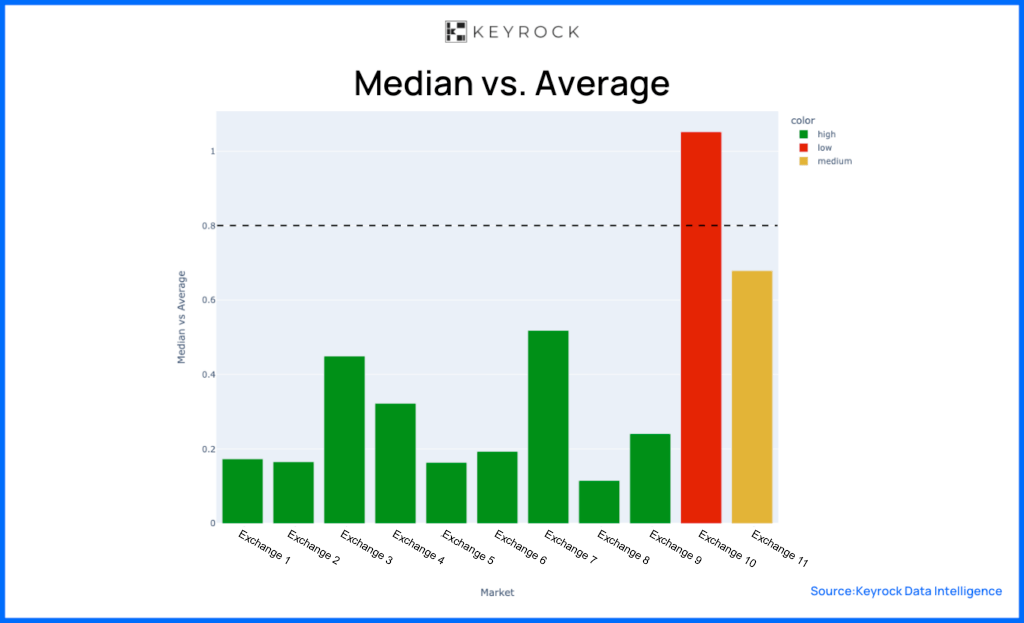
Quality of the Volume
Does the volume align with our expectations for a healthy market? For instance, if all volume occurs within 50bps, or the volumes remain remarkably consistent, almost fixed, at a certain daily quantity, say $1 million volume daily. One of the metrics we use to gauge the volume is the median versus average volume.
Looking at the Median vs. Avg volume of a market across exchanges, we expect a right skew in the market (median < mean). If the mean volume is higher than the median, the volume would suggest inconsistencies.
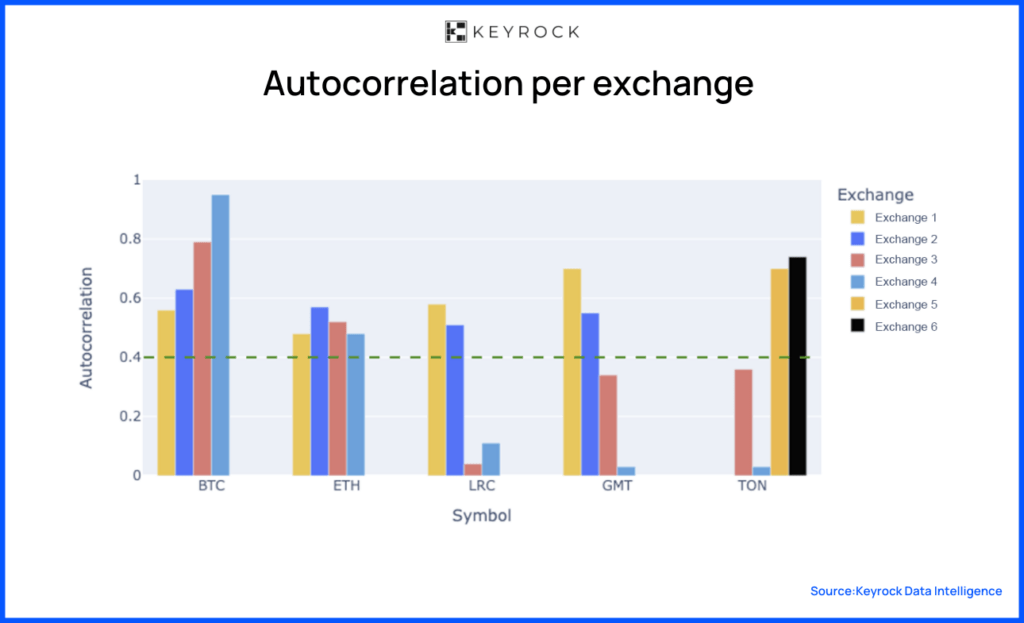
Quality of the trades
Do the trades look organic? What does the frequency of trade sizing look like? Do all trades have the same size, or do they follow a pattern commonly seen in markets, like a power law distribution? Understanding these dynamics helps us gauge the health of the trading activity.
For example, assessing trade quality involves examining the unusual concentration of trades or the autocorrelation in order sign. That is, there is likely to be another buy order after a buy order. Autocorrelations lower than 0.40 suggest that the markets have wash trading.
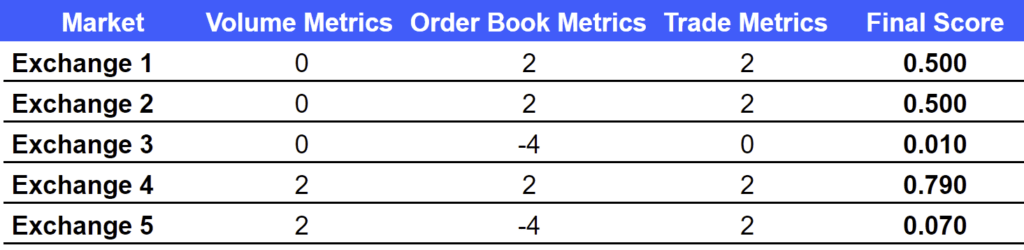
By synthesising these metrics, we derive a comprehensive score for any given token, market, or exchange. This score enables us to detect wash trading activities.