March 27, 2024

L1: How the new non-EVM faves build their DeFi ecosystem

What impact does a fresh layer-1 launch have on liquidity dynamics, TVL, and DEXs volume? To answer these questions, we analysed data 6 months post-launch of four L1s released over the past two years. And here are our findings.

Non-EVM L1s launches: 6 months after

Ever wonder what the liquidity dynamics are, where the TVL sits, and what DEXs volumes look like when a new layer-1 launches? We asked ourselves the same questions. And we started to dig deeper. We analysed data 6 months post-launch of SUI, Aptos, SEI, and Radix. In this piece, our focus is on non-EVM L1s launched over the past two years.

We conducted this research through two lenses. 

First, we look for patterns regarding which kind of protocols or dApps are popular across categories. For example, each chain has a native DEX and money market that takes a large portion of the TVL of the chain until competition develops.

Secondly, we define the key factors that contribute to the short-term success of protocols and chains.

We’ve done a similar analysis about Layer-2 launches (click here to check it out). From our experience, the six-month period post-launch is an optimal window for assessing immediate outcomes and the ability of these chains to attract genuine, organic usage.

Total Value Locked (TVL)

Let’s start with TVL across chains. Despite its limitations and tendency to be inflated by teams, TVL remains a rapid and effective method to gauge capital influx into a chain.

Chains emerged under varied market conditions. Some during bear markets and others near the peaks of bull markets. We’ll look into these later. Our focus now narrows to the absolute TVL from launch, extending 180 days later.

By the end of the observed period, SUI achieved a significant milestone, reaching a TVL of $95 million. Aptos, demonstrating consistent strength, achieved a TVL of $64 million.

Radix has made a promising debut, amassing a TVL of $42 million within 153 days of its launch. SEI has also made commendable progress, reaching TVLs of $17 million.


But does more TVL relate to more activity on a chain? To answer, we gathered more metrics and ratios.

Data breakdown by chain

We’ve mapped the terrain of all ecosystems. Let’s analyse each of them independently. Here, we’ll look into the following metrics/charts: TVL by protocol, TVL by category, and DEXs volumes.

SUI – Analysis


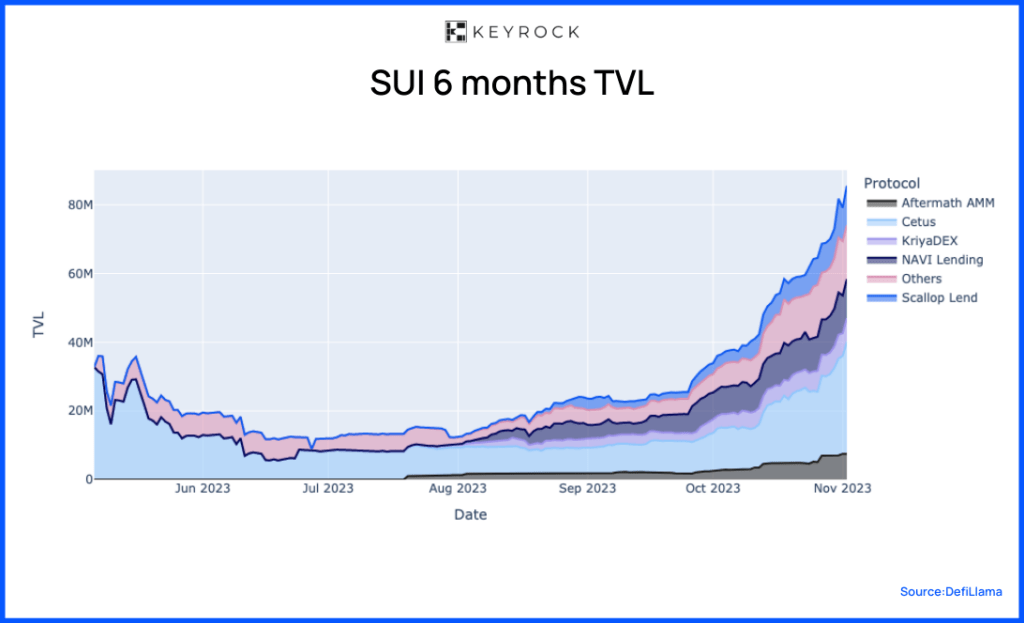
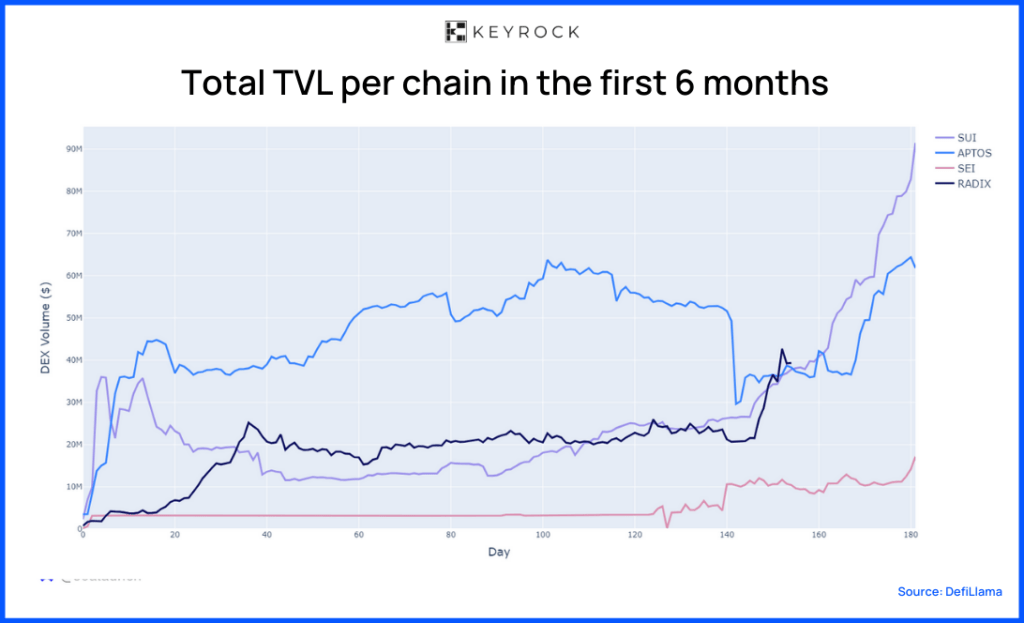
SUI, launched in May 2023, stabilised a TVL of around $20 million during the first four months, later surging to $80 million.

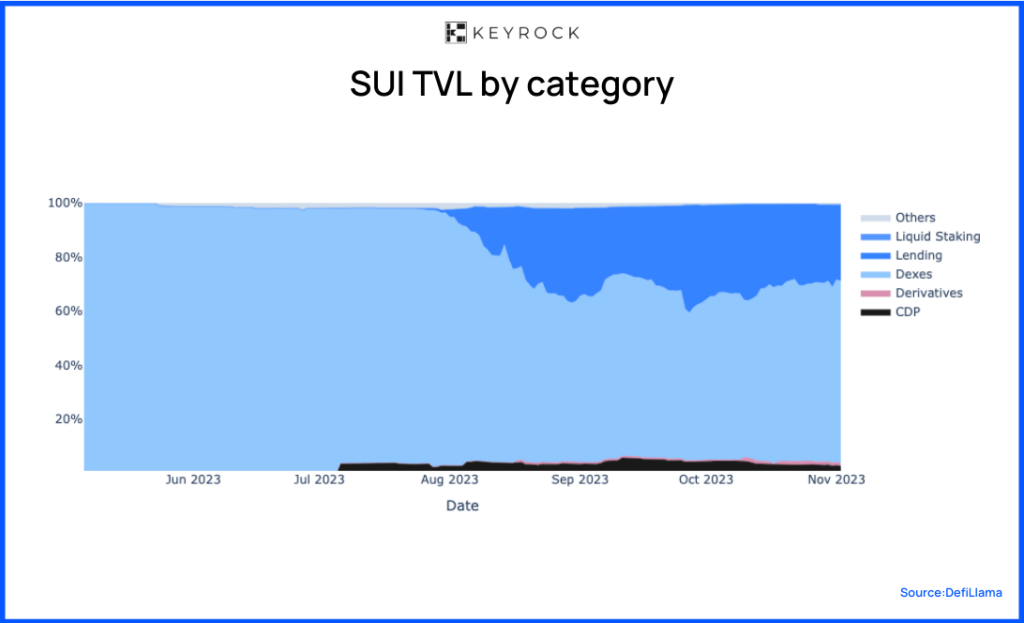
DEXs, spearheaded by Aftermath AMM, CETUS, and Kriya DEX, initially led the chain’s activity. Over time, lending protocols such as NAVI Lending and Scallop Lend began to carve out their dominance, significantly contributing to the chain’s TVL increase.

Though CDP-based stablecoins and derivative protocols piqued interest, their TVLs paled compared to DEXs and lending protocols.


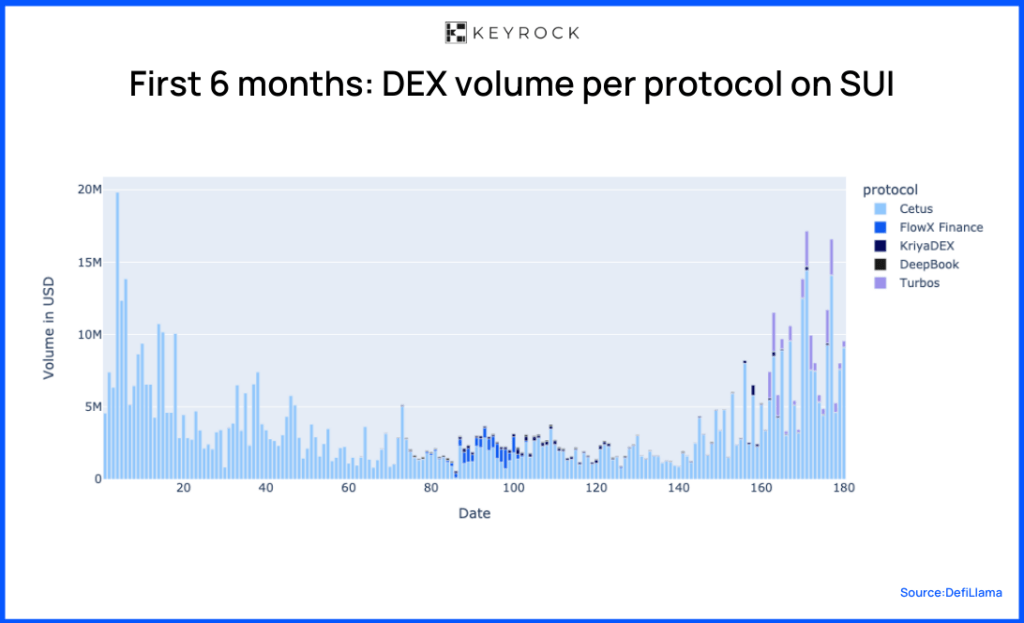
At launch, trading volume surged, peaking at $20 million approximately five days later. Over the initial four months, this figure gradually declined. However, as TVL increased in October 2023, DEX volumes experienced a significant uptick—from an average of $2.5 million daily to $17.5 million. Cetus emerged as the dominant DEX, capturing the majority of this volume.

Aptos – Analysis


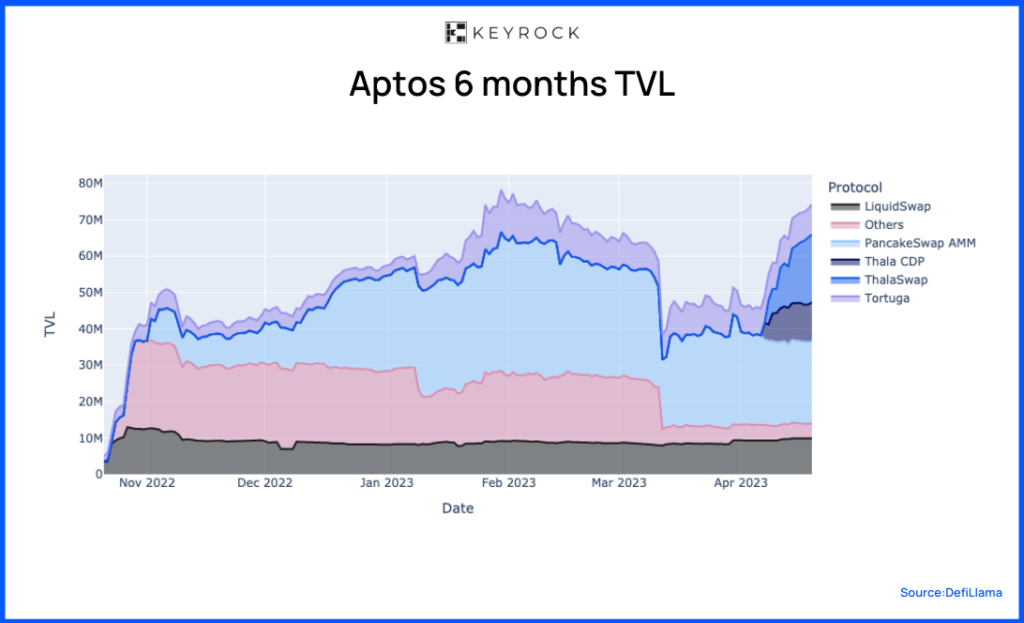
Despite its debut during a bear market, Aptos swiftly garnered attention, securing over $40 million and climaxing at $75 million by the close of our snapshot.

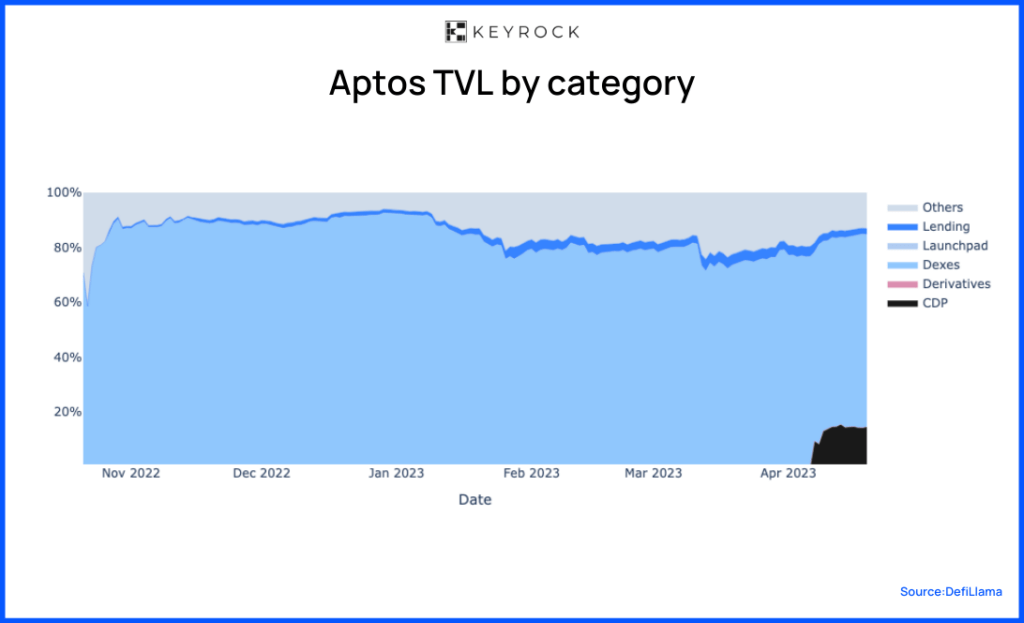
DEXs, notably Liquidswap, PancakeSwap, and ThalaSwap, dominated the chain’s TVL, accounting for 60% to 80%. Hot on their heels, liquid staking protocols like Tortuga and Thala CDP gained traction as the snapshot period ended. Meanwhile, derivatives, lending, and launchpads played more marginal roles in the TVL landscape.


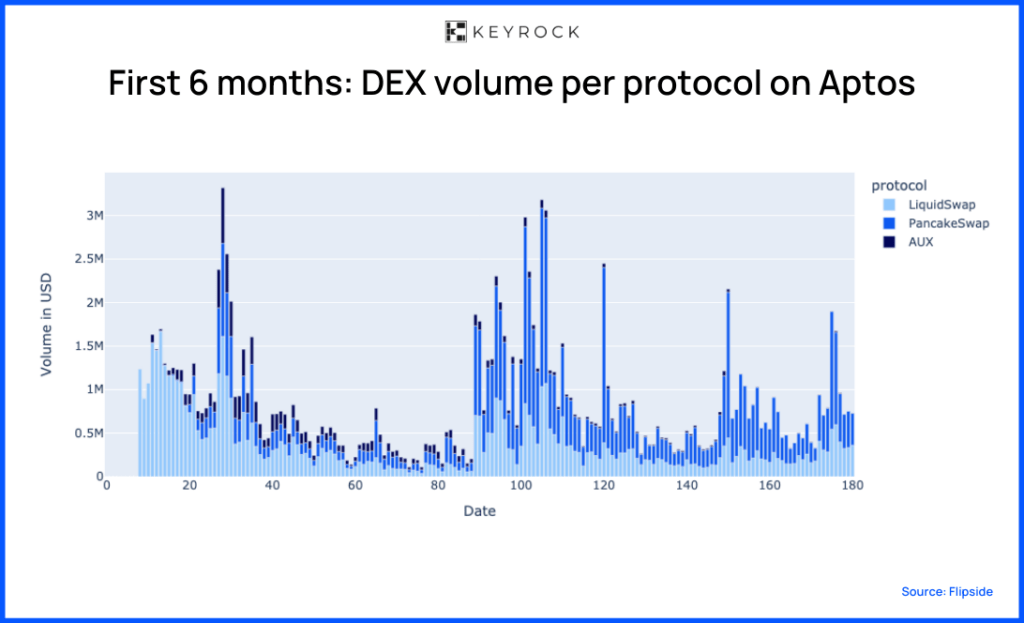
Note: Data is solely on the APT/USDC pool as a proxy to facilitate comparison across exchanges, given that APT/USDC is the most liquid pair on the exchanges.


Activity was pretty high during the first 2 months. Coincidentally, a period of very low activity occurred during the FTX blowup. Despite Liquidswap boasting approximately $10 million in liquidity, daily trading volumes hovered between $500k and $1m. 

This trend reversed in early January, with volumes and activity surging and remaining somewhat stable until the end of the snapshot. Most of this volume occurred on Pancakeswap, likely because it’s the DEX with the most liquidity.

Radix – Analysis


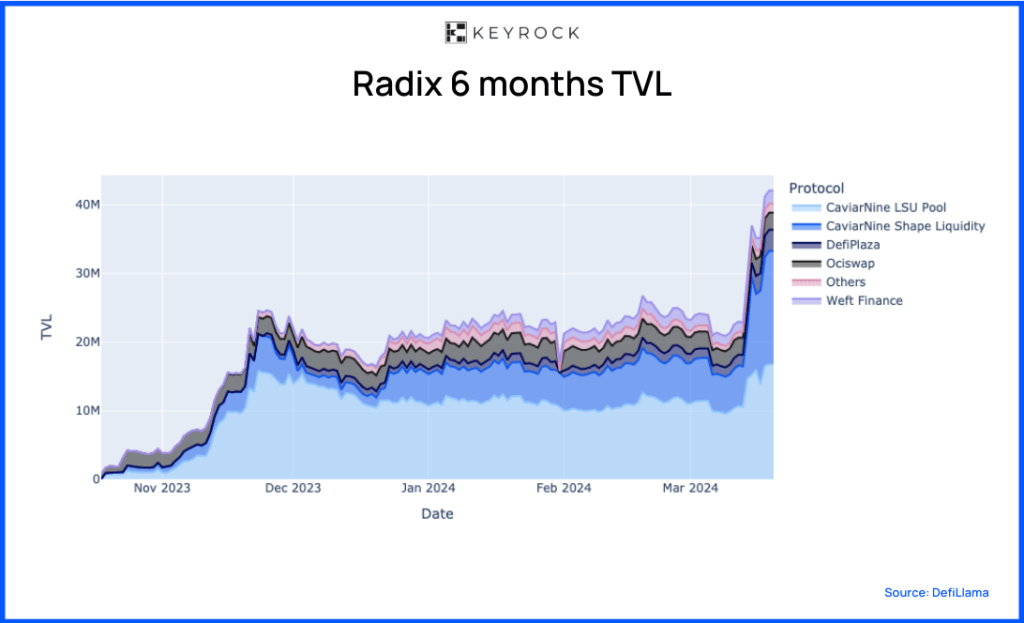
Radix made steady progress toward $25 million from its inception. It hit the $25m mark approximately 30 days after launch. Over the following three months, its Total Value Locked (TVL) remained stable. Having launched in October 2023, our analysis is based on four months of data.

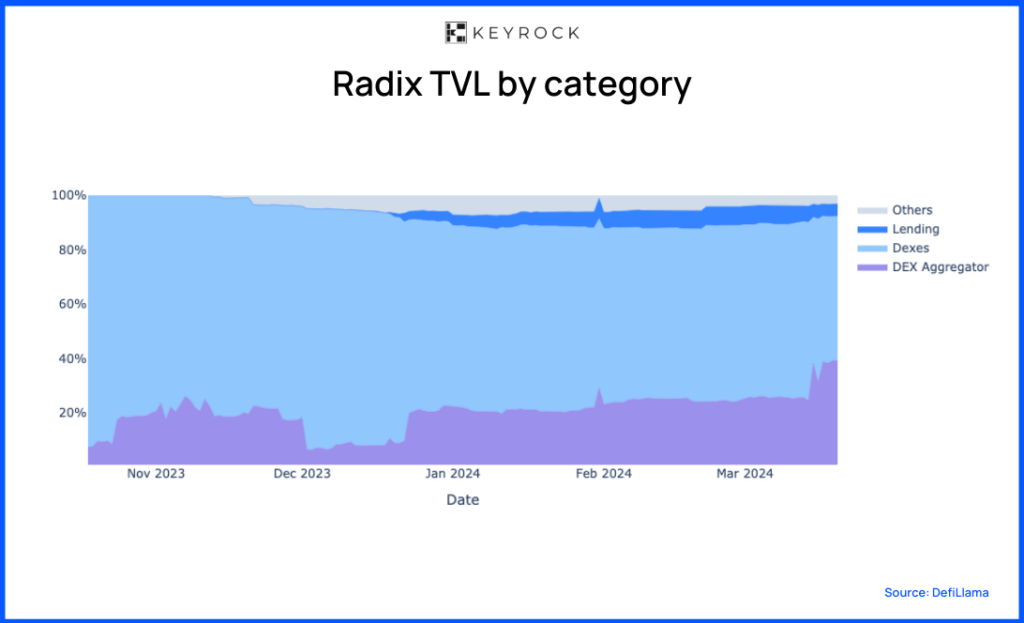
DEXs and DEX Aggregators, such as CaviarNine and DefiPlaza, spearheaded the chain’s TVL, contributing between 80% and 100% of its total. Though still emerging on Radix, lending is predominantly offered by Weft Finance, accounting for less than 5% of the TVL.


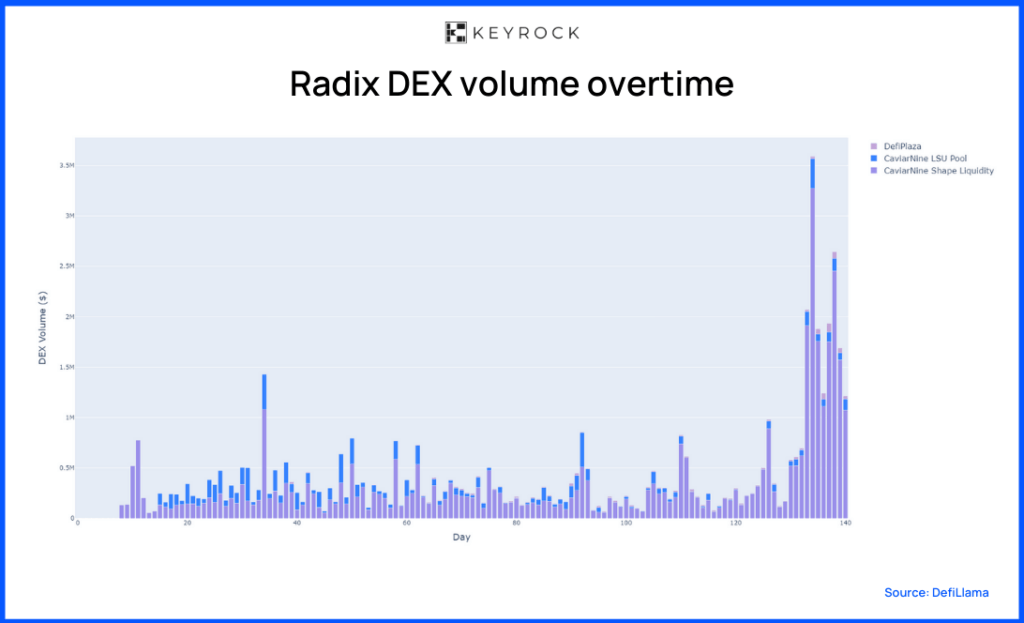
Radix achieved a TVL of $25 million, but the DEX activity remained subdued in the initial months. The average daily volume fell below $400k. Like other chains, DEX activity picked up towards the end of the snapshot, and roughly $1 million to $3.5 million were traded daily. Caviarnine, with both the LSU and Shape Liquidity, took the lead on Radix’s ecosystem.

SEI – Analysis


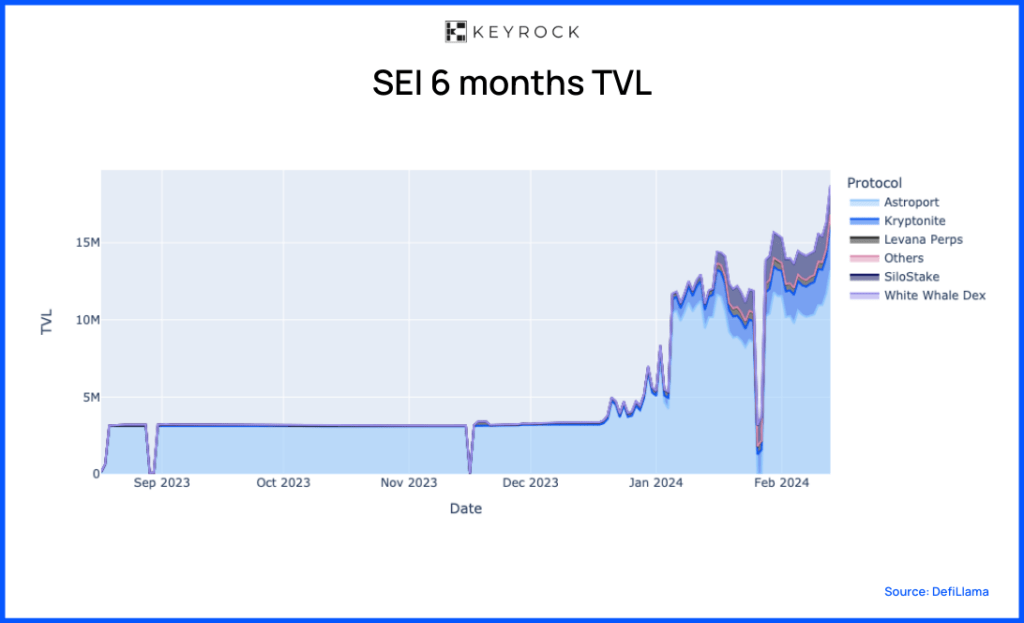
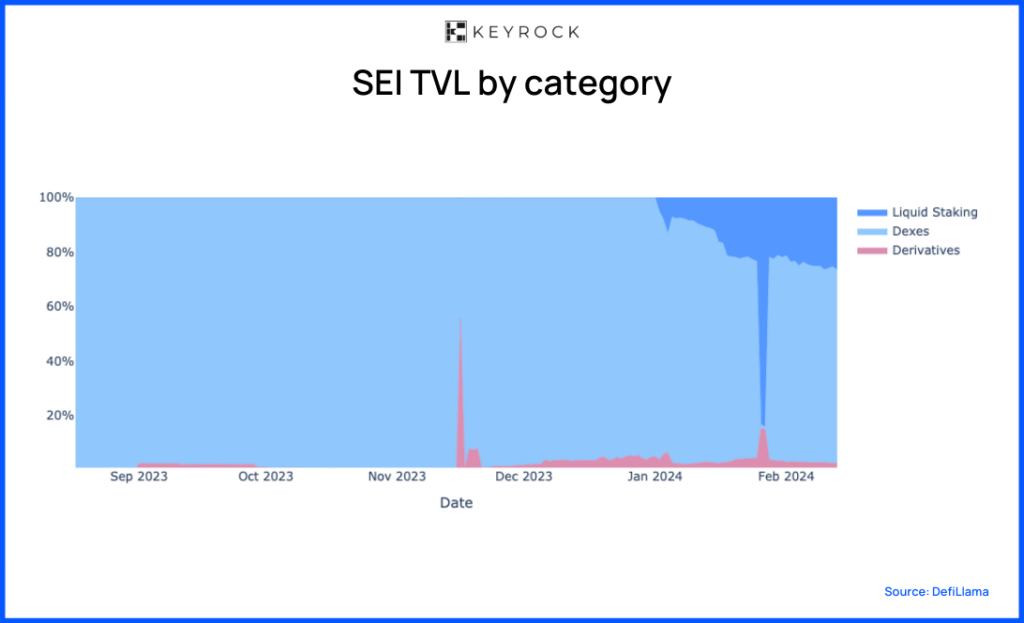
Launching amid the bear market’s lowest point, sentiment-wise, SEI faced challenges in attracting capital. Nevertheless, it has successfully drawn $5 million in Astroport since its launch. However, breaking this initial ceiling took four months. Subsequently, SEI’s TVL quickly tripled, surpassing $15 million by the end of our snapshot.

Astroport accounted for 100% of the TVL for the first four months. The launch of liquid staking protocols, Kryptonite and SiloStake, transformed this landscape.


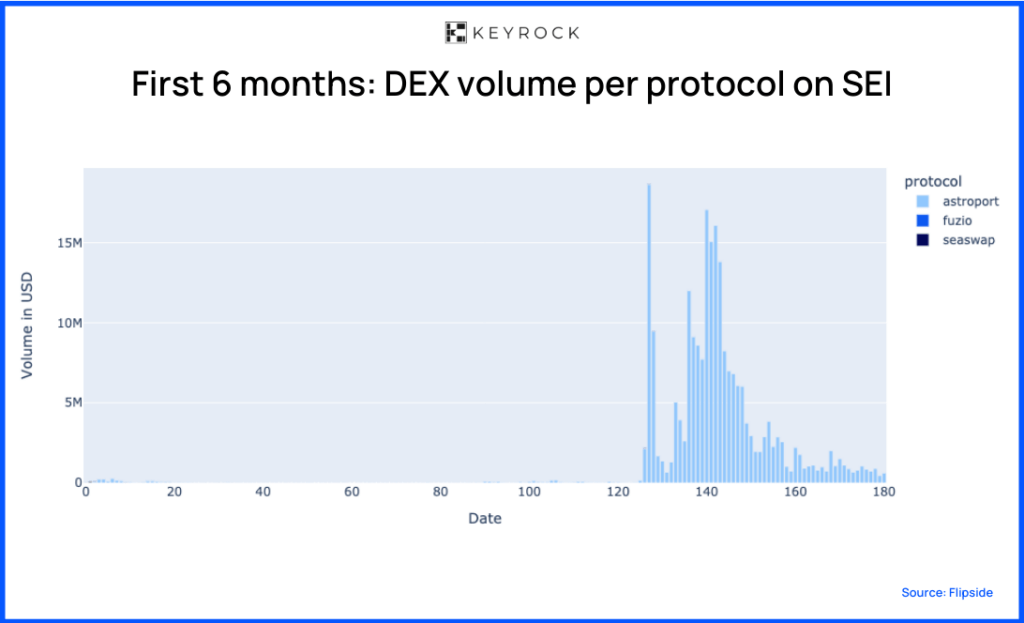
Note: Here, the data take into account trades which contain SEI, USDC, or USDC.eth.


Despite a lower Total Value Locked (TVL) compared to other chains, the DEX volumes stand out, signalling robust DeFi-DEX engagement. Astroport dominates the DEX market thanks to its unrivalled liquidity. The activity remained subdued until a surge in late December 2023, when volumes peaked at $18 million.

Wrapping it up

Each chain across the board features a dominant DEX. To the point that these DEXs lead in terms of the chain’s TVL. The reason? DEXs are often the first DeFi primitive established, enabling users to swap tokens.

Following the establishment of DEXs, the subsequent development typically involves creating a money market. Beyond facilitating asset borrowing and lending, money markets also provide access to leverage. While this access may seem rudimentary, it serves its purpose until the launch of derivatives protocols.

Transaction Metrics

Examining transactions adds more colour when measuring activity. A transfer can involve the deployment of a smart contract or any activity that includes a token transfer, such as deposits, staking, withdrawals, swaps, and burns.

However, transactions are metrics subjected to manipulation for various reasons. For example, spam transactions are designed intentionally to overwhelm and congest the network rather than to transfer value or meaningfully interact with smart contracts. As a result, a careful approach is needed when looking into these digits.

TVL Correlation

As more capital flows in a chain, does it relate to more usage? Or is it inversely correlated?


The data reveals that capital inflows and transaction volumes share no discernible link for Sei and Sui. Pearson correlation coefficients stand at -0.04, 0.01 and -0.10, respectively, confirming a lack of connection.

Conversely, Aptos presents a contrasting narrative. A negative correlation emerges between transaction volumes and TVL. Over time, as TVL rises, transaction counts decline, indicated by a Pearson correlation factor of -0.60. 

Price Correlation

Do people use a chain more often if the price action of the chain’s native token is bullish?


On Aptos and Sei, a clear pattern between transaction count and price does not emerge, reflected by low Pearson correlation values. Conversely, for SUI, post-token launch, we observe a mild positive correlation of 0.52. As the token decreases in price, so does the number of transactions.

Looking forward

Our data indicate that DEXs emerge as a fundamental requirement for chains. Across all chains, DEXs rank as the most popular category by TVL, typically followed by lending and liquid staking derivatives.

This outcome is expected. Bridging to a new ecosystem necessitates actions such as acquiring more gas tokens or purchasing native tokens, which DEXs facilitate.

New ecosystems require primitives already established in others, with swapping and money markets being perpetual necessities. As these ecosystems mature and the fundamentals are established, other primitives, such as perpetual DEXs, liquid staking, stablecoins, and yield aggregators, can be developed.

Things are a bit more nuanced, though, since DEX volumes are not correlated with the amount of transactions or TVL in the early stages. Chains like Sui and Aptos experienced significant surges in DEX volumes following periods of relatively low activity, emphasising the potential for rapid shifts in market dynamics, especially in the early stages.

That being said, most chains have a very dominant DEX. For instance, Cetus on Sui or Astroport on SEI captured the majority of trading volumes, highlighting the importance of competitive advantages such as superior liquidity and first mover advantage.

For most chains, no clear patterns emerge from the number of transaction data, either standalone or compared to TVL or the price action of chain tokens.

Aptos shows a negative correlation with TVL, where transactions move inversely to TVL, and SUI exhibits a positive correlation, with transactions moving in tandem with the price.

Our findings suggest that transaction counts or price actions do not correlate with TVL or DEX-Volumes, indicating that initial activity levels are not predictive of future success.

Follow us on X and LinkedIn to have more on-chain and off-chain liquidity insights.